Hackathon project, tracking fake news in social networks
On April 3-6 2020 I took part in the Hackathon LauzHack against COVID-19 organized by the LauzHack association and EPFL. It was an interesting experience and I would like to summarize here the results we got during the 3 days on our project, as well as my impressions.
I jumped on the occasion to propose a project related to the analysis of fake news and controversial topics about the COVID-19. The project was named ‘Tracking fake news in social networks’. Indeed, I have been working on a research project since September 2019 whose goal is to detect and analyse controversies in social networks. It is a joint research project between the Academy of Journalism at Neuchatel, the RTS (Swiss Radio and Television) and our lab, the LTS2 at EPFL. I thought it would be a good opportunity to share our knowledge about this phenomenon and make some concrete contributions to fight misinformation.
I was glad to see people supporting this project and commenting on it. About 25 participants joined the project to see what it was about. Some of them were really concerned by the topic and willing to help, worried about the enormous amount of fake news and misinformation on the coronavirus. Some others were just curious about how we would process and tackle this challenge. Overall, 6-7 participants were really active, coding scripts or analysing the data. Due to the circumstances, the hackathon was a purely online one, without physical interactions. Everyone was working from home. Interestingly, all the interactions took place using Slack and video-conference and it worked! However, I had the feeling that it was less efficient than an onsite Hackathon. From time to time, participants (including myself) would disappear for a short or long period of time. Of course, distractions are numerous at home and no-one is watching you :).
Goal
The goal of the project was to collect posts in different social networks and detect fake news or controversies about the COVID-19. Several objectives were defined with different level of difficulties. The most ambitious goal was to detect automatically fake news. Intermediate objectives were to collect the fake news of the past weeks and make a historical timeline about them, or at least to produce some statistics about controversies and news concerning the COVID-19 in social networks.
Method
The difficult task was to detect fake news (or controversies) among the huge amount of data. At first sight, this looks challenging as human themselves are often unable to spot them. However, firstly several scientific studies have shown that fake news are usually more popular, spread more and faster in the social network. This indirect sign suggests focusing on the spreading behaviour rather than on the content of a post or tweet. Secondly, particular users, such as conspiracists, extremists, have a tendency to heavily share fake news. Identifying and selecting such accounts or channels should help in our task.
After a short discussion, and based on participants preferences, Reddit and Twitter were selected as the social networks we would investigate. We organized the project into 2 focused subteams and an additional group of participants, making the connection between the teams and suggesting ideas in an ‘agile’ way. The first subteam was dedicated to the collection of Reddit data related to the COVID and the other to the collection of Tweets. For that, they used Python and the APIs provided by the 2 platforms.
Experience from the research project was very helpful to get a quick start. We had already analyzed several subreddits for the project and the choice was easy. We quickly oriented our focus on subreddits related to the coronavirus. We knew 3 interesting ones, each of them with a different ‘editorial line’. The subreddit r/China_flu has more posts sharing controversial topics, r/Coronavirus is rather neutral and r/COVID-19 contains more scientific discussions. In order to design an automatic detection, tagging posts and topics as controversial, neutral or scientific would be indeed valuable. We collected posts and links inside posts, especially links referring to tweets. The list of tweets in each subreddit was then given to the second team, dedicated to the extraction of tweets. Analysis of tweets was then performed by all participants interested.
The results
The analysis of Tweeter and Reddit data gave us several insights about the Coronavirus and the sharing of information inside these social networks. I am happy to share it here.
Graph of Twitter users
The first results came directly from the tools developed for the research project. We made the list of Twitter users obtained from the references in the 3 subreddits. A graph was created from it, you can see it below. The nodes are users of the list and users mentioned by the users in the list. Connections are made between them if one of them has mentioned or retweeted the other at least twice. This graph shows the organization of the social network around users sharing news about the COVID19.
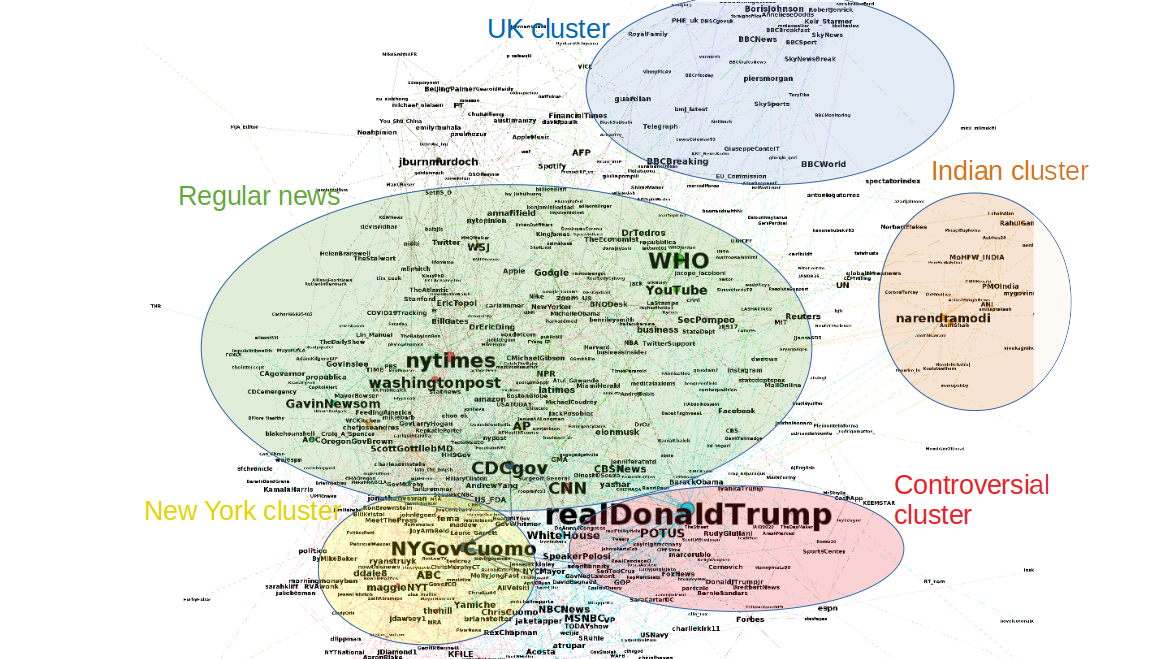
The first fact to notice is that this network is not made of isolated clusters. There are different communities (at least the 3: diffusing controversies, neutral and scientific info) but there is no clear separation between them. Users do not really isolate from each other, and regular news are diffused by all, even by extremists or conspiracists. This is shown by the fact that established institutions such as WHO and CDC as well as regular news, the NY Times, Washington Post or CNN are situated at the centre of the graph (light green area). This is unusual as conspiracists are often isolated from the rest and form (mis)information bubbles.
A closer look reveals regions in the network that have different topics. They are situated at the periphery. These regions are indicated on the figure by coloured circles. Some parts focus on the events of specific countries or areas (the UK on top, India on the right and New York at the bottom). Other regions are distinguished by their orientation. A region in light red concentrates several accounts sharing controversies. We can see the account of the US president in this region as they often refer to him.
An interactive version is available where the graph can be explorer in more details.
Word cloud
The second result was obtained by extracting the text of all the tweets extracted from Reddit. Selecting the most popular keywords (made of one, two or three words), we got this interesting word cloud having the shape of a virus.
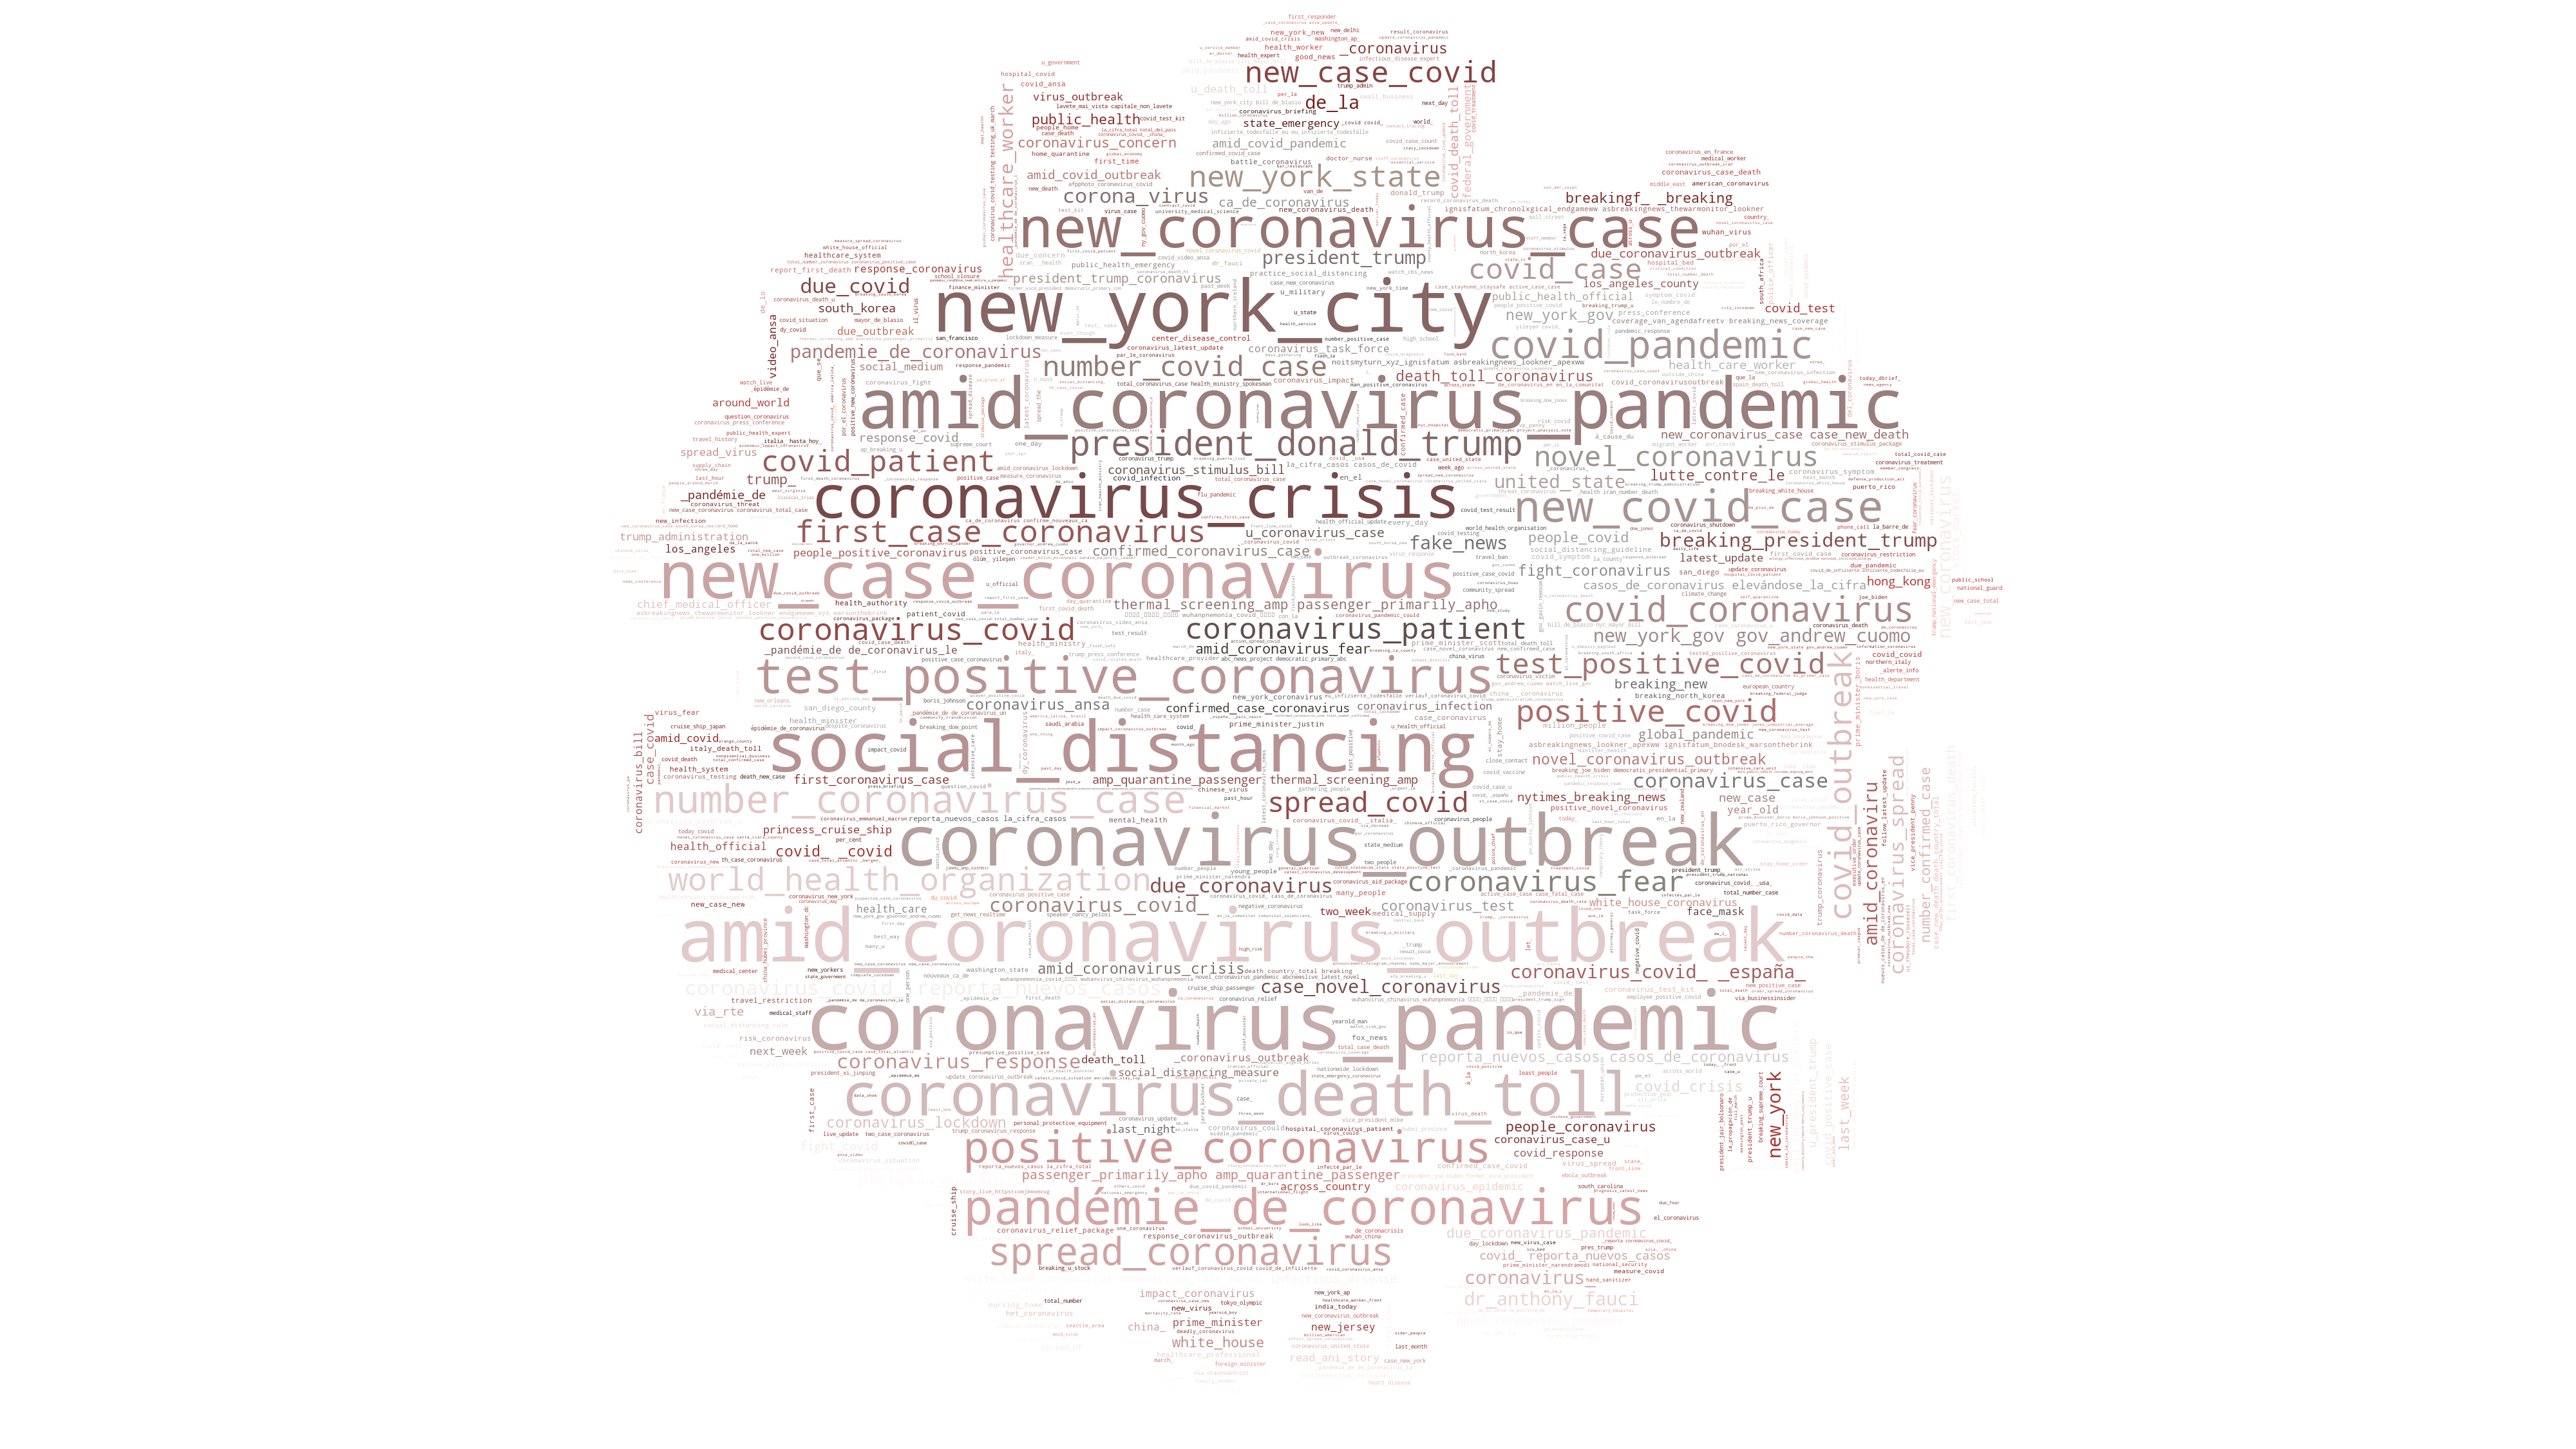
No surprise, the most popular expressions contain ‘coronavirus’, ‘outbreak’ or ‘pandemic’.
Evolution of the number of tweets
We also plotted the number of tweets per day appearing in the subreddits, concerning particular countries.
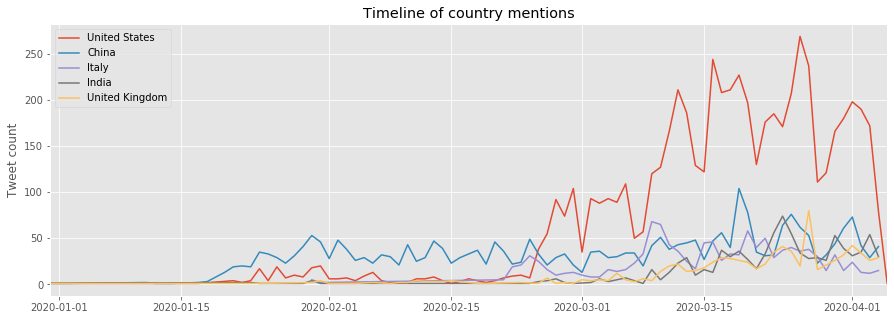
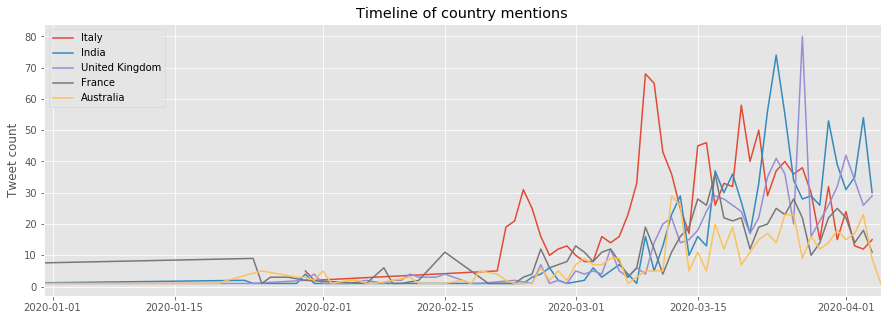
The US is over-represented as the subreddits are in English and most of its users are from the US. That is why we provide a second plot without it. On the first plot, it is interesting to notice the high number of tweets concerning China at the beginning of the epidemy. One can remember the numerous fake news at that time about how the virus was supposed to be a Chinese biological weapon, an accidental leakage from a Wuhan lab or due to 5G. Videos of the streets of Wuhan and overcrowded hospitals went viral too.
Concerning the other countries, on the second plot, peaks can be seen when particular events or news about the virus appears. For example, Italy red curve peaks on the 25/02 when north of Italy was confined and on the 10/03 when all of Italy was confined.
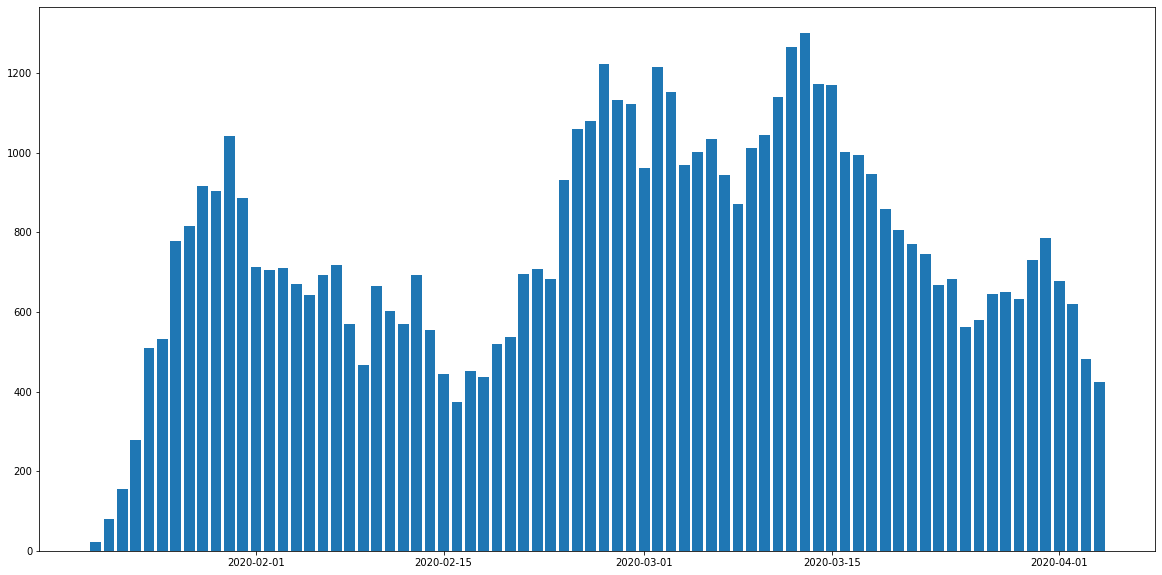
Outside of Twitter, the number of posts per day in the controversial subreddit r/china_flu (next figure) shows several peaks between January and April. It highlights periods when major events occurred, triggering many discussions and a higher exchange of information. Starting from mid-January the subreddit users are increasingly sharing information about the situation in Wuhan and the spreading of the virus in China and outside. It reaches a peak at the end of the month when the WHO declares coronavirus a global health emergency. There is also a sharp increase after the 15th of February when people started to realize the epidemy was becoming a pandemy with the increasing number of deaths in Europe. A peak can be seen around the 15th of March where several European countries decided to confine their population (Italy fully on the 10th, Spain 14th, France 17th, Belgium 18th).
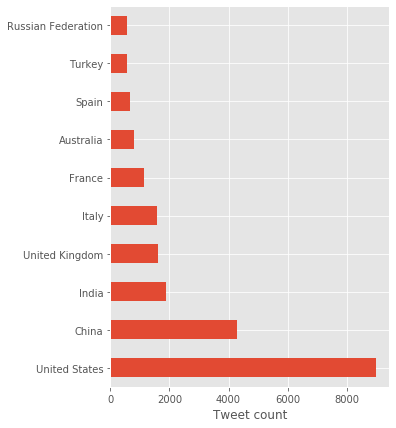
Difference between countries
The top countries discussed in the subreddits are shown in the following figure. It reflects the countries where COVID-19 cases are the highest. Of course, the USA is the most discussed country, twice more than China, as the language of the subreddits is English and most of the users are from the USA.
Limits of the Twitter data
Twitter is doing a good job of removing fake news from its platform. Several tweets found in Reddit were not available anymore to us. That may explain why we did not get as many fake news as we expected.
Conclusion
The page of our project can be found here. In there, the information is minimal as we were short in time to prepare a good communication about our results. We must also say that designing an automatic detection of fake news was highly ambitious for a 3 days Hackathon.
What we obtained is more modest, but it gave interesting information on social networks, Reddit and Twitter, and how the information about COVID-19 is treated and shared. It also gave us a boost of motivation seeing the enthusiasm of people around and the first results that brought more questions than answers (in particular about fake news!). This was definitely useful for our research project!